Dedicated Wealth Management
Evidence-based fund & ETF investing | Wealth planning | Exceptional service you can count on
Our Mission is Your Success
FundX investment advisers are fiduciaries who act in your best interests. Our clients come to us for our
active investing strategies, disciplined portfolio management, and seamless client service.
We've helped generations of clients build and preserve wealth for more than 50 years. Find out more about how we can
help you move forward on your financial goals.
About Us


Our Latest Insights
Featured Articles

Higher interest rates have been a game changer for investors. After years of historically low yields that forced some in...
Jun 21 2023

Investors and markets alike were rattled in March 2023 as Silicon Valley Bank and Signature Bank were declared insolvent...
Apr 4 2023
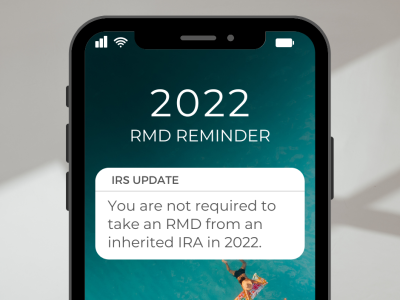
Managing an inherited IRA can be complicated. How should you take distributions from an inherited IRA? Do you need to ta...
Dec 16 2022
FundX is now a division of One Capital Management (OCM), a Southern California-based wealth management firm and register...
Mar 1 2022
Featured In